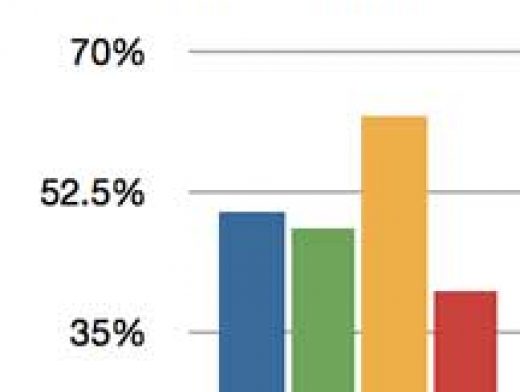
Carousel Interaction Stats
Carousels. That gem of a web feature that clients love, and many developers hate. One thing is certain, they are the darling of HigherEd. In fact, they’re loved so much, I’ve been assigned many times to retroactively add them to sites that have already been live for years. This led me ask how much are users really interacting with the carousels. To answer this question I added tracking to to the main feature on ND.edu as well as four other Notre Dame sites with carousels, three of which are static, and one that automatically slides the features. Here’s what I’m tracking:
- Number of times the feature is switched by users
- Total feature clicks
- Total clicks per position
I’m also tracking interactions such as how many times the feature is switched using arrows vs. the dots (pagination), but that’s not the focus of this article.